

Ripple [XRP] was trading at the lows of a range that stretched back to mid-April. A recent AMBCrypto report pointed out that the price formed a bullish pattern during its recent days of consolidation.
If the price can manage to break out of this wedge pattern, a 30-40% move upward would become more likely. But as things stand, the momentum and volume indicators highlight bearish pressure.


Source: Santiment
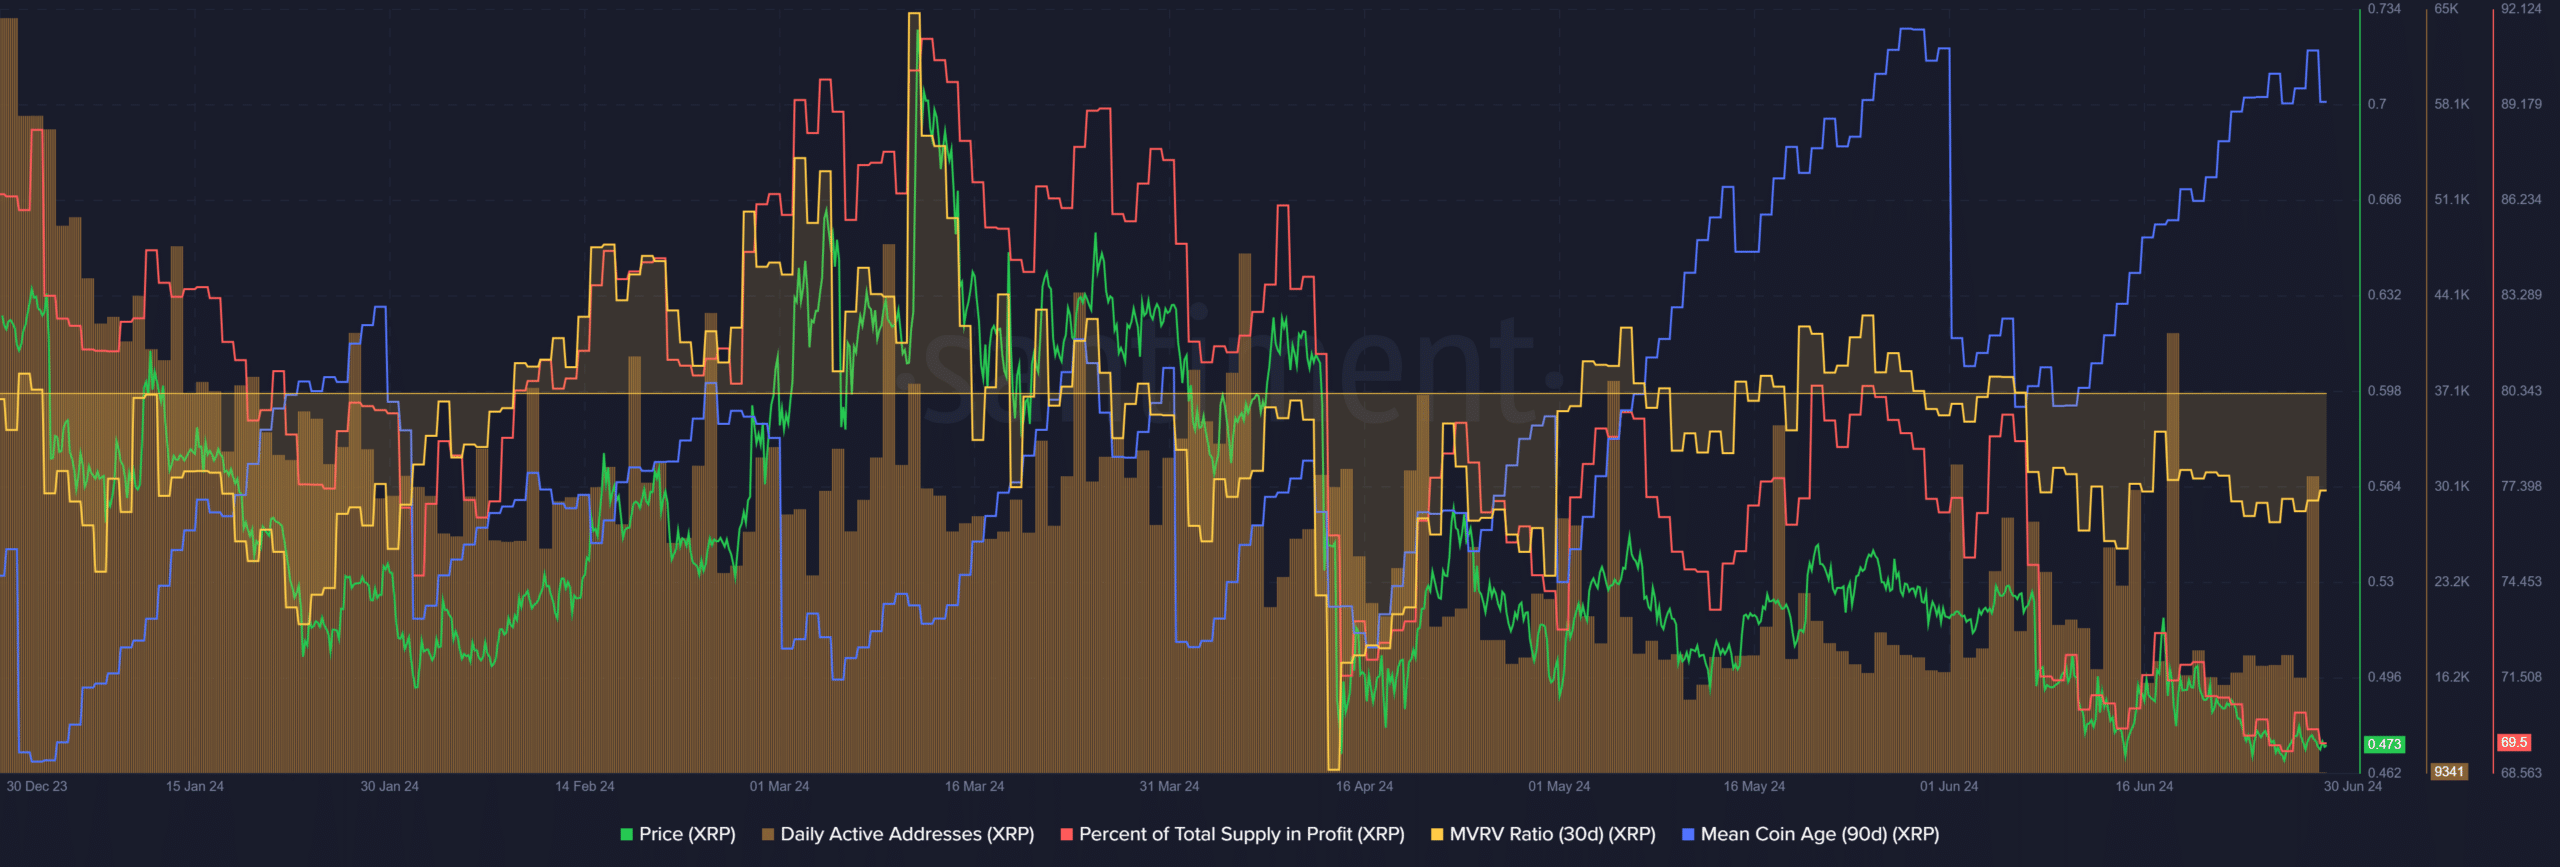
The daily active addresses have slowly trended downward since late March. On certain days there were large spikes in activity but overall the metric trended lower. This was a negative sign and indicated reduced usage and demand.
The percent supply in profit also went down with prices in June, unsurprisingly. The price move saw the 30-day MVRV drop into negative territory.
However, in the past month, the mean coin age began to trend upward.
Together, the rising mean coin age and falling MVRV showed accumulation and an undervalued asset and was a buy signal. Should traders take it?


Source: Hyblock
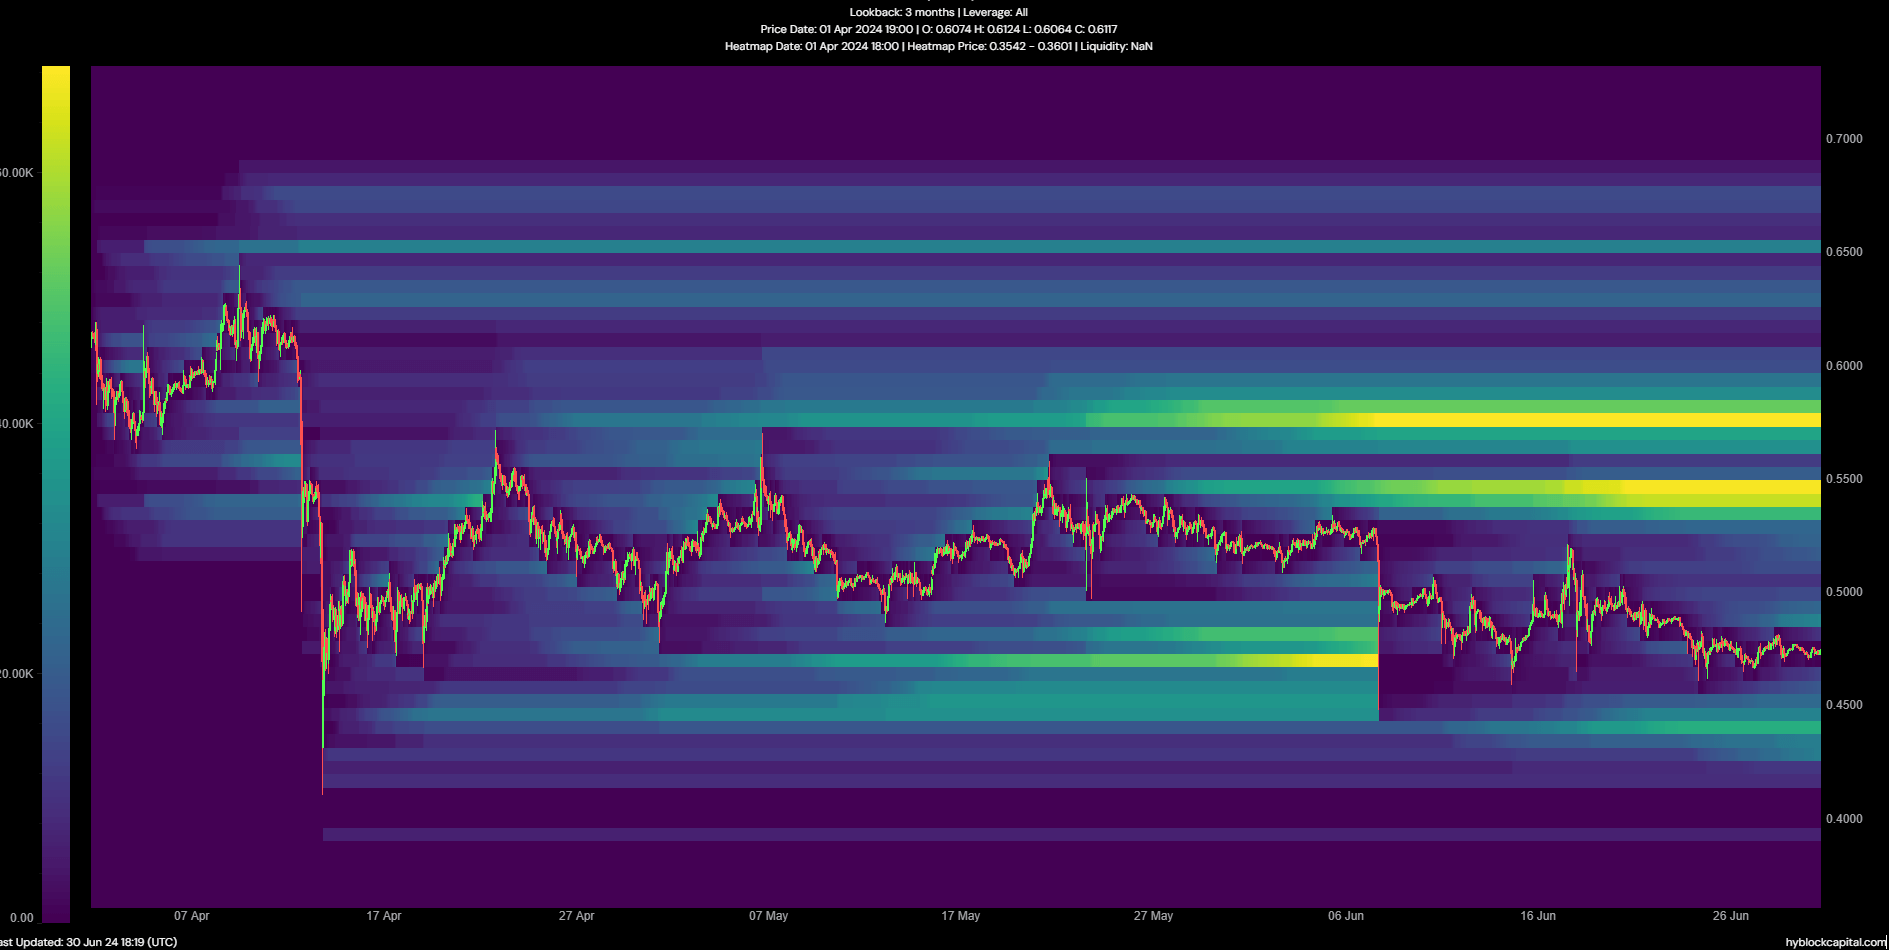
The liquidation heatmap showed a high concentration of liquidation levels just below the $0.55 level. This magnetic zone is likely to attract prices higher toward the short liquidations.
However, the $0.436 presented another attractive pocket of liquidity closer to market prices.


Source: Hyblock
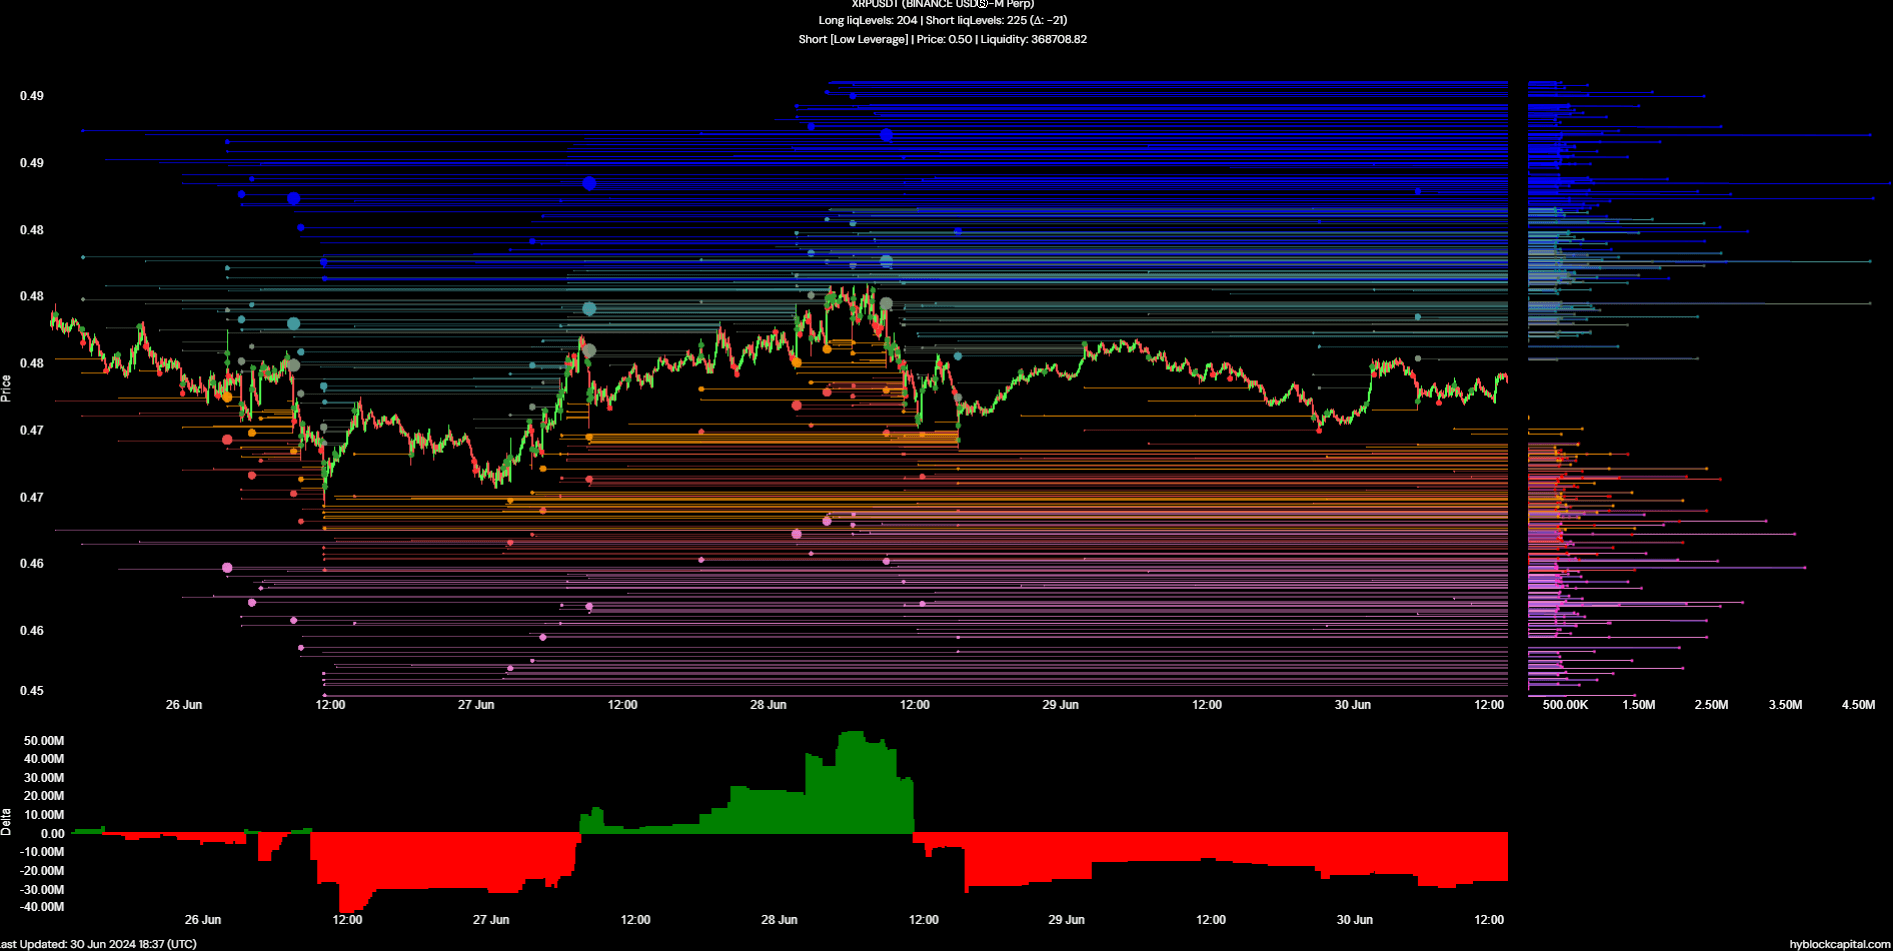
The cumulative liquidation levels delta was keenly negative. This meant that the long liquidation levels were outnumbered by the short liquidation levels by a sizeable amount.
Realistic or not, here’s XRP’s market cap in BTC’s terms
In turn, it implied that a move higher could commence to squeeze out these short sellers. The $0.485 level is a key short-term target that is nearly 2.5% above prices. In one scenario, XRP reverses its recent losses and surges toward $0.55.
The other scenario could see XRP move to $0.485-$0.49, face rejection to fall to $0.436, and then initiate a recovery that would send prices toward the $0.56 range high. Traders must be prepared and be ready to adapt according to the situation.